What is the “Conversations” Feed/Section all about?
Radarr allows you to view your data in 3 main formats –
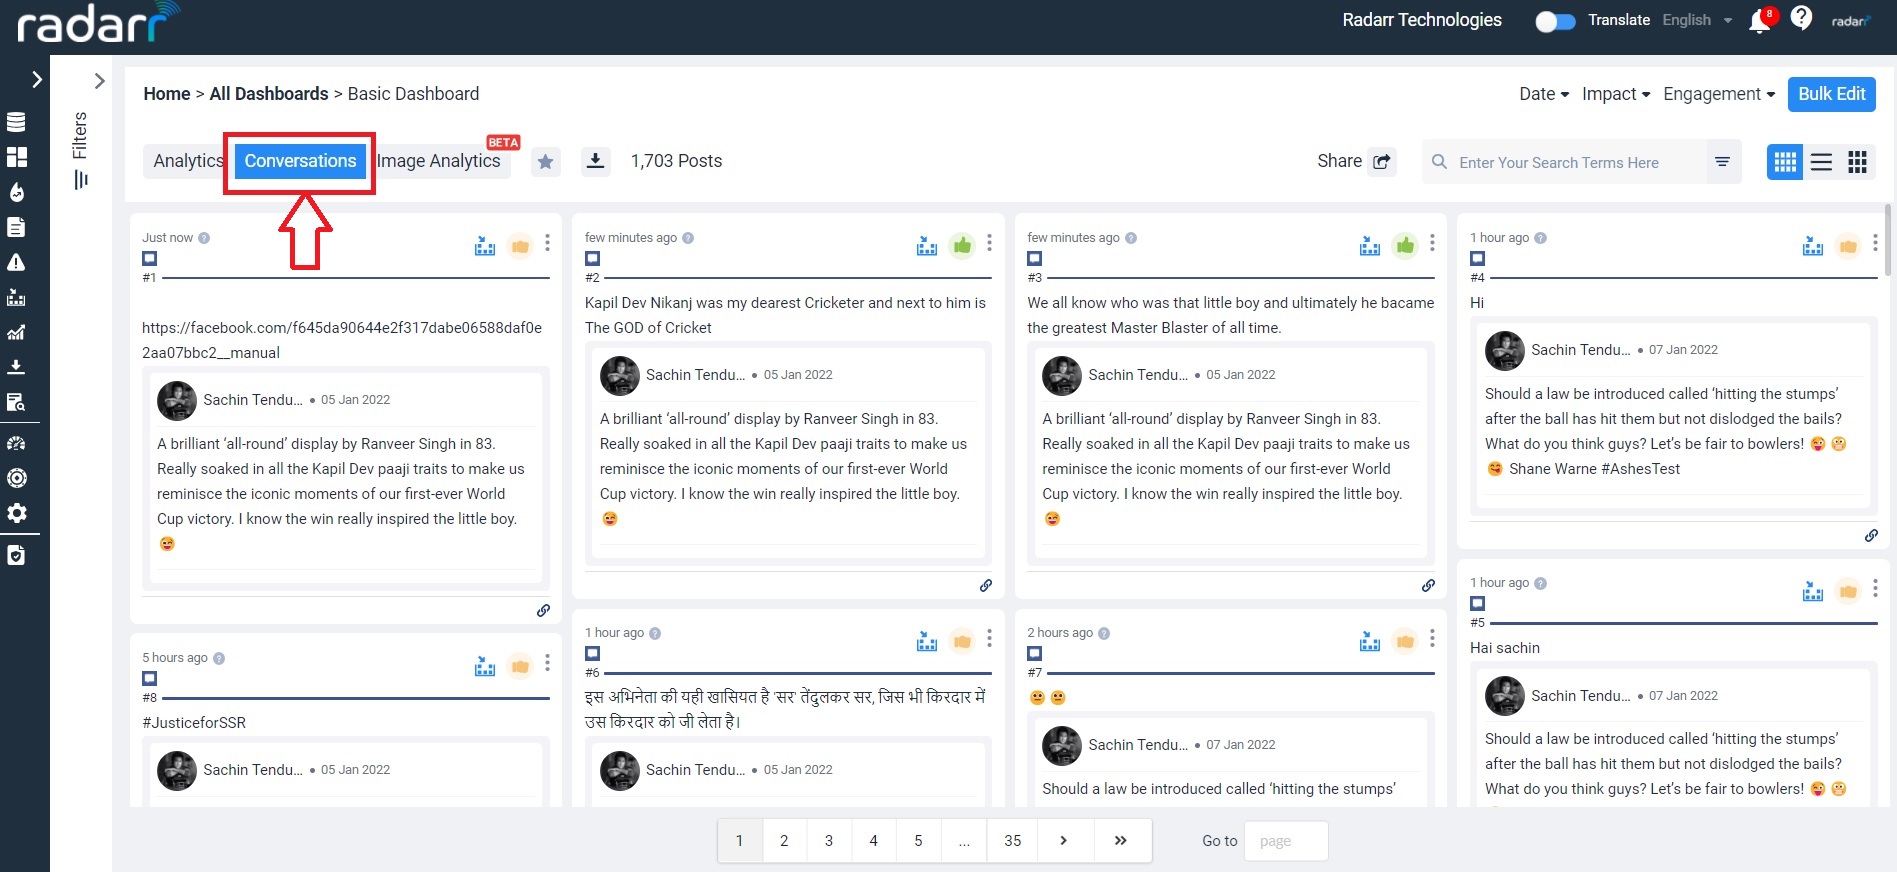
- As a raw conversations feed – The Conversations Feed
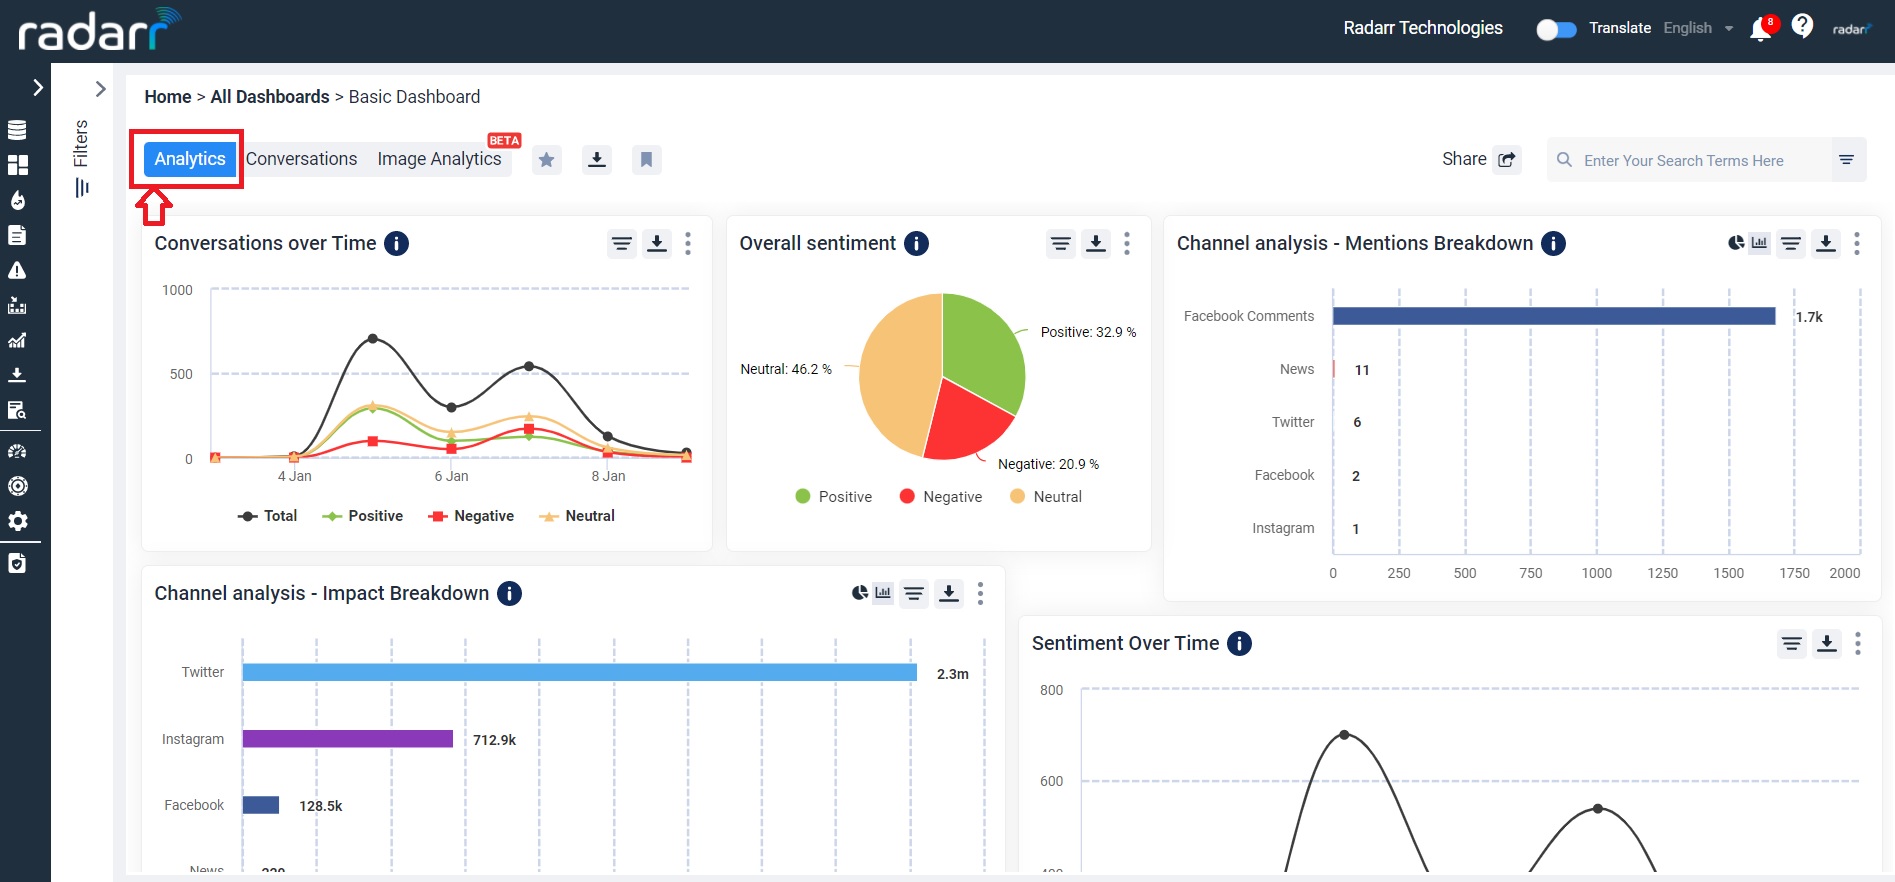
- As visualizations of your data – Analytics Section
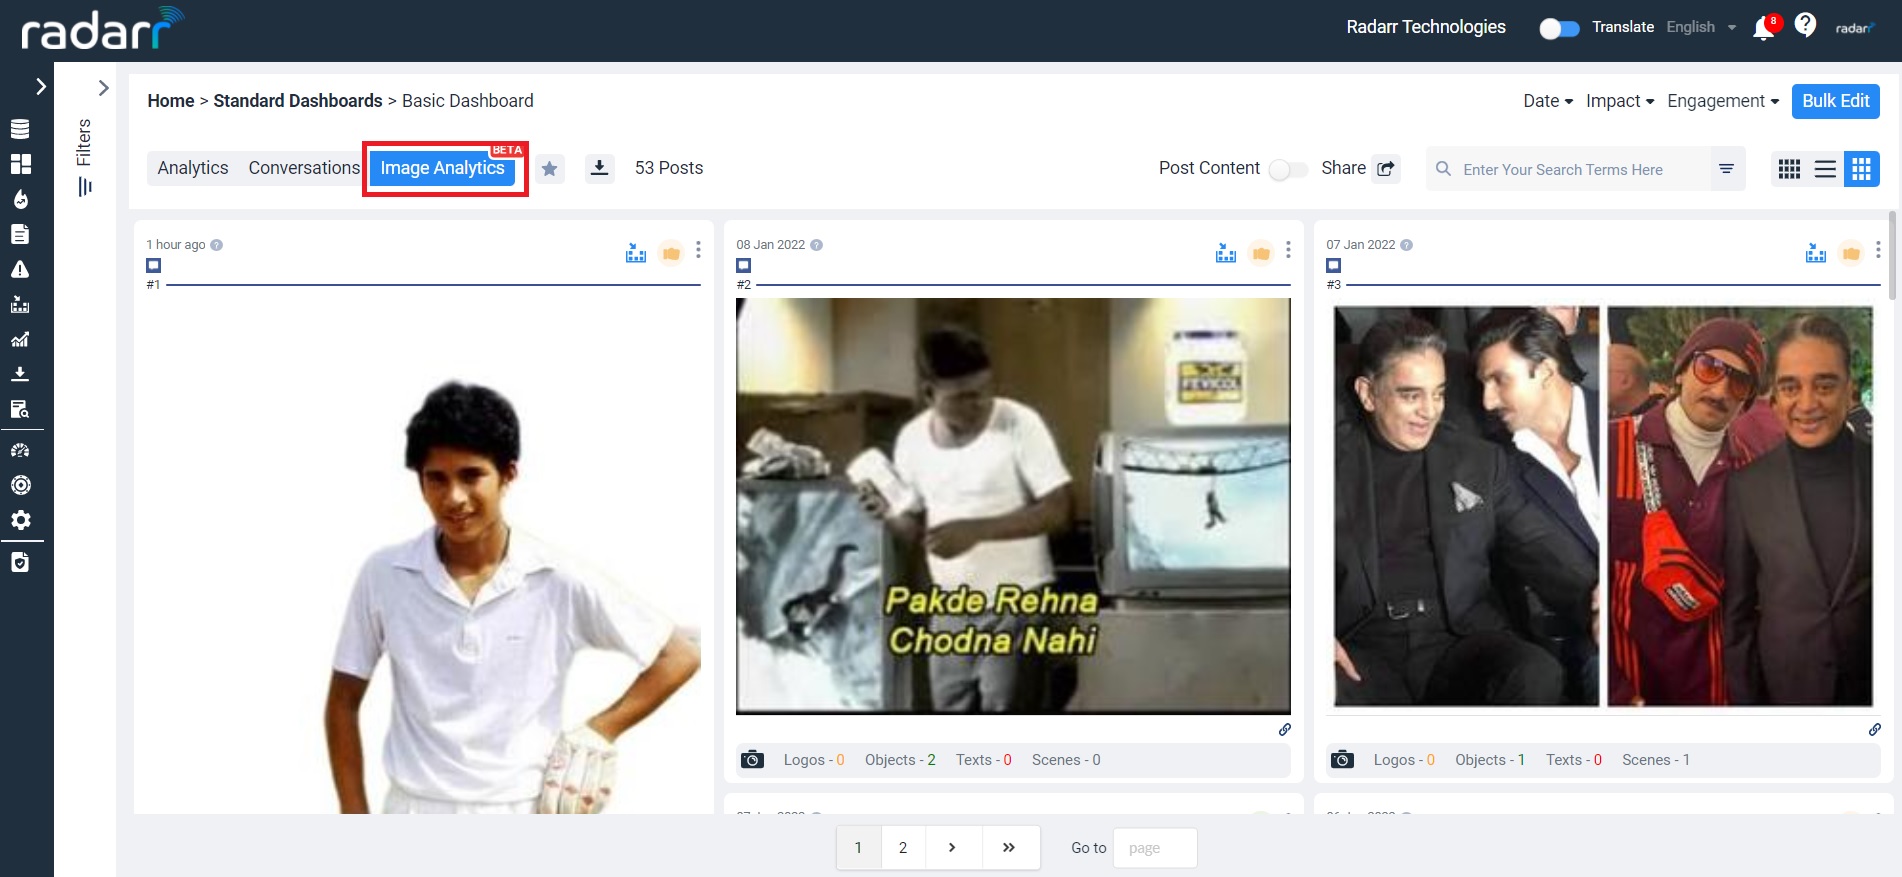
- Visualization of the images which consists data relevant to the requirement – Image analytics
The “Conversations” feed consists of all the actual mentions you have collected for the topics of your interest. It displays data from across all the platforms, accounts, languages and locations of interest. It is displayed in a feed format with the latest posts appearing at the top by default. You may change the order of these posts or sort them by their engagement scores or Impact or sentiment. Upon hovering over each post, you can also easily access “Action Buttons” that will allow users to bookmark, share or delete these posts.

To visualize all this data, you can head over to the “Analytics” section.

To visualize the data which consists of images with relevant data as per our requirement, we can head over to “Image analytics”.
