How to create a Dashboard
Radarr allows to create your own dashboard and below are the following steps to create a dashboard
Dashboards can be created under Radarr’s Listening module.
Step 1: Click on Listening Module from the left-hand side panel

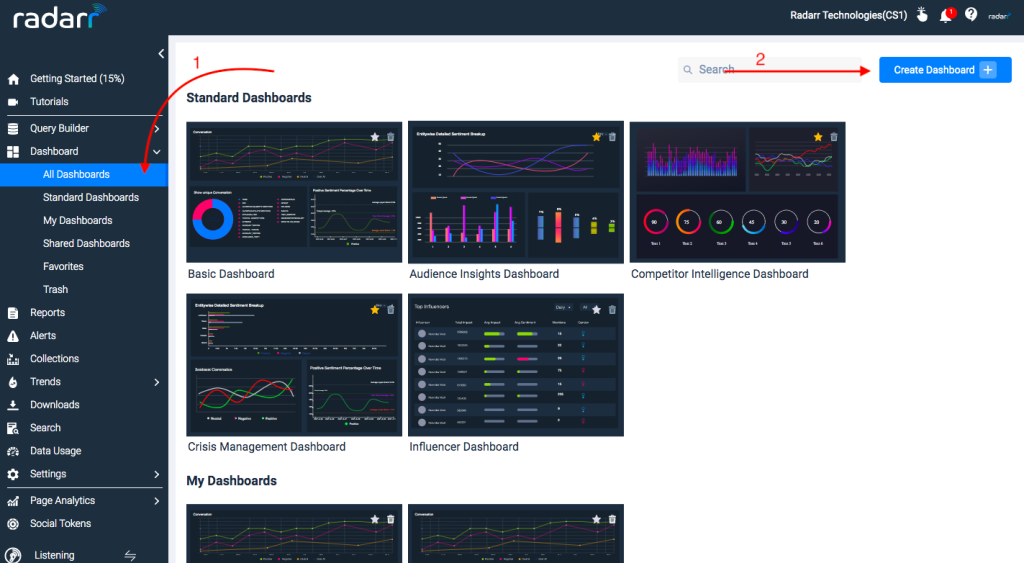
Step 2: Click on Dashboards from the left-hand side panel of Radarr Platform.
A dashboard can be created in two ways, either you can clone an existing Dashboard or you can create your own dashboard.
Step 3: Click on “Create Dashboard”

Step 3: Give a desired name and description to your dashboard and click on create.

As you can see we Cloned a Dashboard and given a name to the new dashboard

Step 4: You can now find the created dashboard under “My dashboard” and then click on your desired dashboard.

Step 5: Now click on “Filters” to select the required data scope such as topics, location, duration and else. Save them all once done for future reference and click apply.

Step 6: To visualize the data click on “ Add charts “. Then drag and drop the charts you find interesting from the left chart to the right deck such as top influencers, moments analysis, else.

Step 7: You can rearrange the charts as per your preference.

Step 8: Dashboard is now ready to be used.
For more details please refer to the below video