Comprehensive Media monitoring and Analysis
Radarr allows you to view your data in 3 main formats –
- A visualizations of your data – Analytics Section
- A raw conversations feed – Conversations Feed
- A visualizations of your image data – Image Analytics
The “Analytics” section allows you to visualize all your data by way of several charts and helps you get to your insights faster.
There are several subsections within the “Analytics” section that allow you to quickly reach and draw the insights that are of most relevance to you. These are as below –
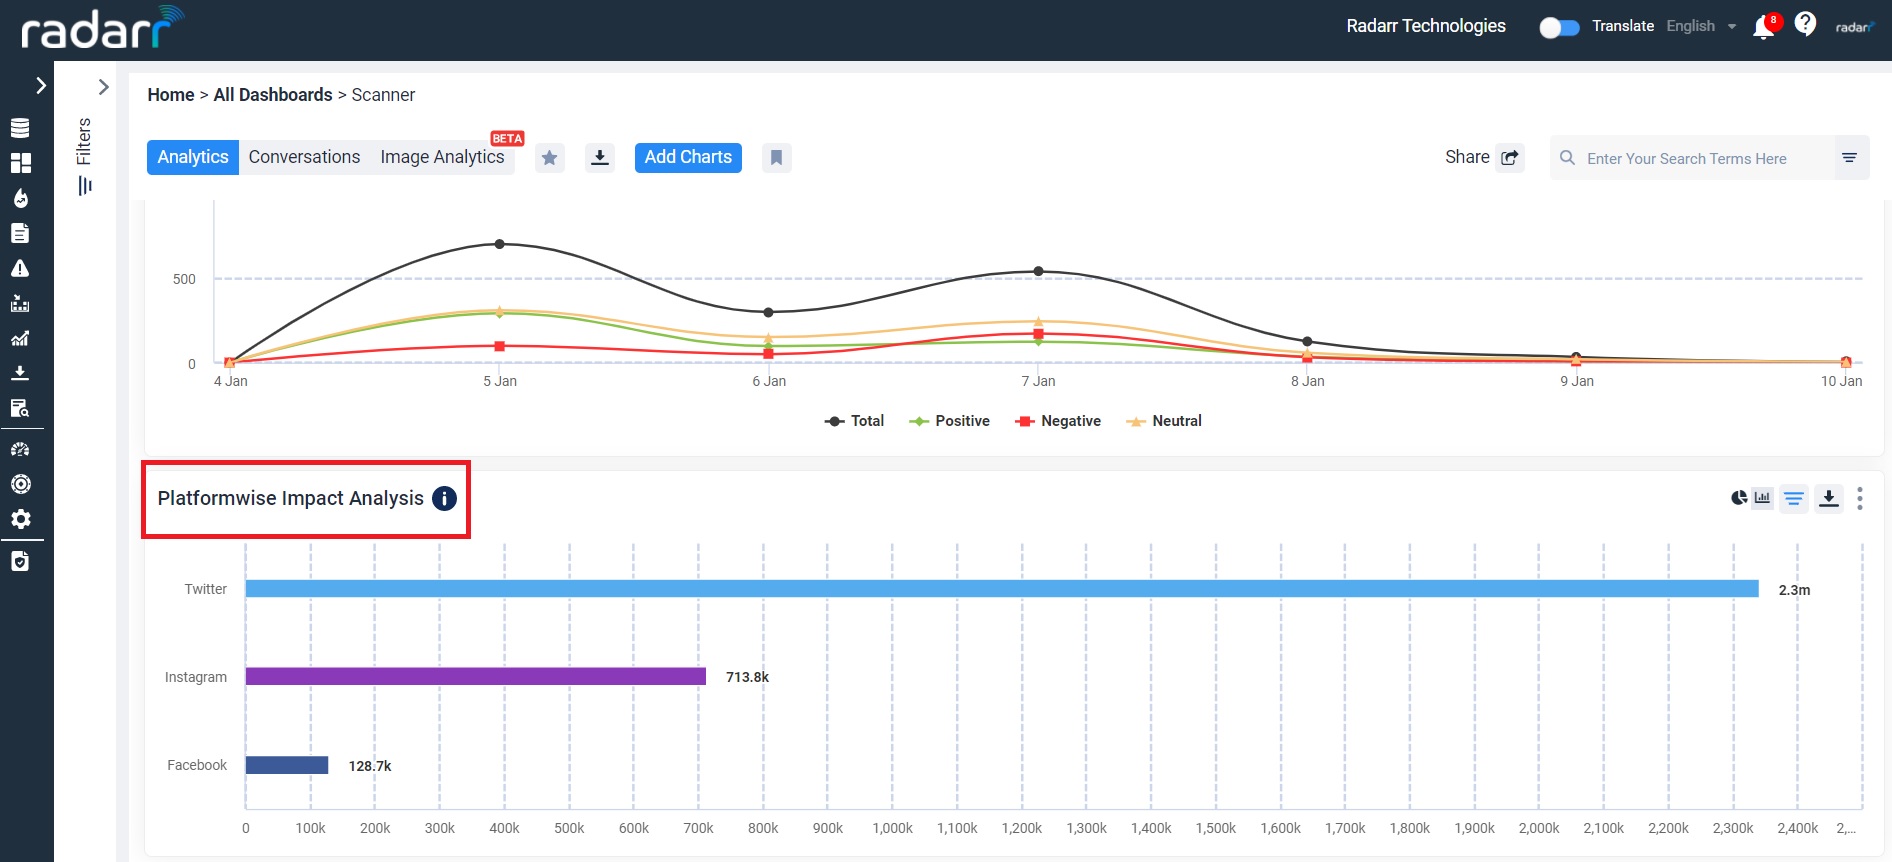
- Conversations Over Time – Represent how positive, negative and neutral sentiments have changed over time across the periods for the topics selected.

- Overall sentiments – Represent the volume of overall positive, negative and neutral sentiments for the duration and topic selected as per filters

- Platform Mentions Breakdown – Allows you to see a breakdown of platforms on conversations volumes.

- Platform wise Impact Analysis – Allows you to see a breakdown of platforms based on impact score.
- Sentiment Overtime– Represents how positive, negative and neutral sentiments have changed overtime across the period for the topics selected as per filter

- Word Cloud – Gives you top 100 words that were mentioned within a chosen topic to help you identify trends or patterns. Click on a word to open a second level word cloud and keep going deeper in a specific trend to garner better insights.

- Top Influencers – Represent top influencers for the given filters

8. Overall Share of Voice – This chart will provide you with a share of voice for the topics you have selected in the filters. This chart uses volume of conversations to determine share of voice.

9. Share of Voice by News Sources – This chart provides a share of voice for the news topics you have selected in the filters.

10. Share of Voice by Subtopics – For each topic selected in the filters, this chart provides a share of voice for the sub-topics you have selected. This chart uses volume of conversations to determine “share of voice”.

11. Raw Conversations – This chart shows raw conversations for the selected filters.

NOTE: Every chart in the Insights section can be interacted with and can be downloaded in the form of a PNG or CSV for use offline.
Please reach us at support@radarr.com for any concerns.