Radarr Help and Support
Outgoing message Analysis chart in SMR
Table of Contents
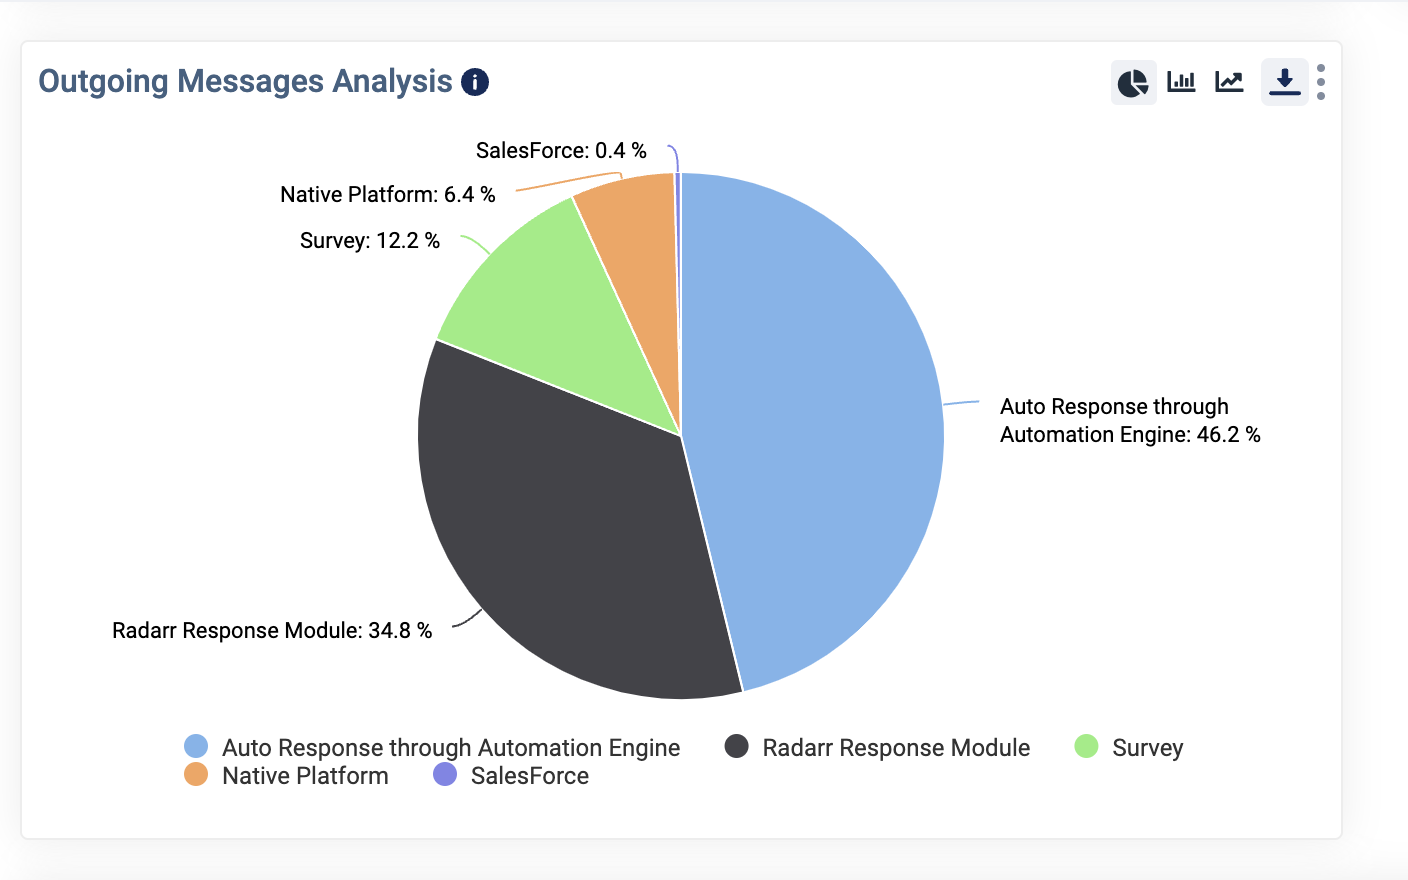
Outgoing message Analysis chart shows the distribution of outgoing messages across different channels, including messages generated on the native platform, Radarr manual responses from agents, Salesforce interactions, Automation Engine auto responses, and auto responses during non-business hours.
In this analysis, we will focus on only duration between the creation and updating of messages rather than the ticket creation and updation duration.
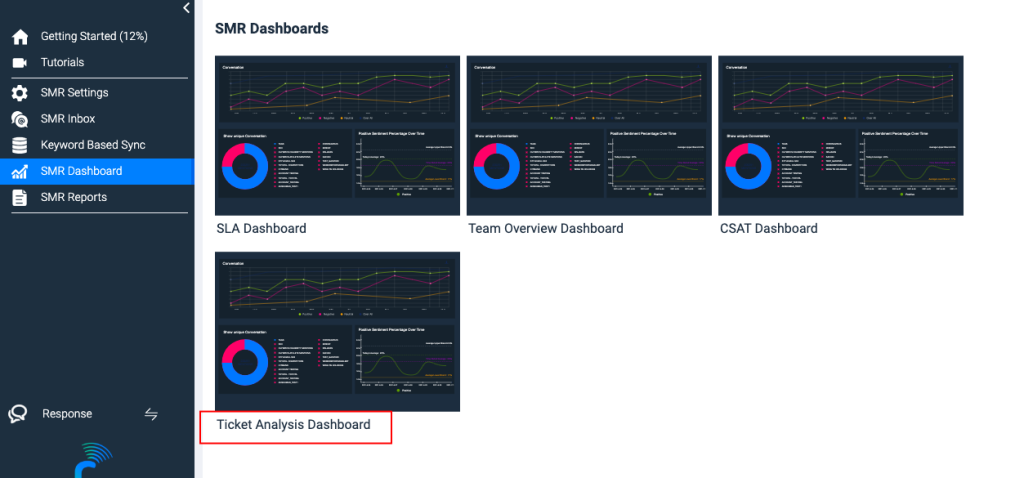
A new chart is available under the Ticket Analysis Dashboard in SMR Module
The chart name is “Outgoing messages Analysis”
Navigate to the Ticket Analysis Dashboard as shown below
- The chart can be a pie, line and bar chart
- The data will be based on the number of outgoing messages sent in different ways
The outgoing message will include from the following :
- Auto response through Automation Engine
- Survey
- Radarr Response Module
- Native platform
- Salesforce
- Auto Response through Business hours
The chart will be available for download in the following format:
- CSV
- PNG