LinkedIn Insights – Charts & Metrics Explained
LinkedIn Insights can be found under Page Analytics section which gives you the ability to see information about who follows you, engages with your content and provides access to LinkedIn data and insights, giving the clarity and tools you need to do smarter planning. Creates a foundation of high quality, real-time data directly to you.
Radarr has got over more than 15 charts available in two view modes to help you with actionable insights on whether you’re hiring, promoting, or putting together marketing strategies, LinkedIn Insights can help you make the most of an already powerful business platform.
We have divided this into two sections where you will learn how to track, measure, and optimize LinkedIn data using LinkedIn analytics.
Section A : Drill down on the metrics for a specific post
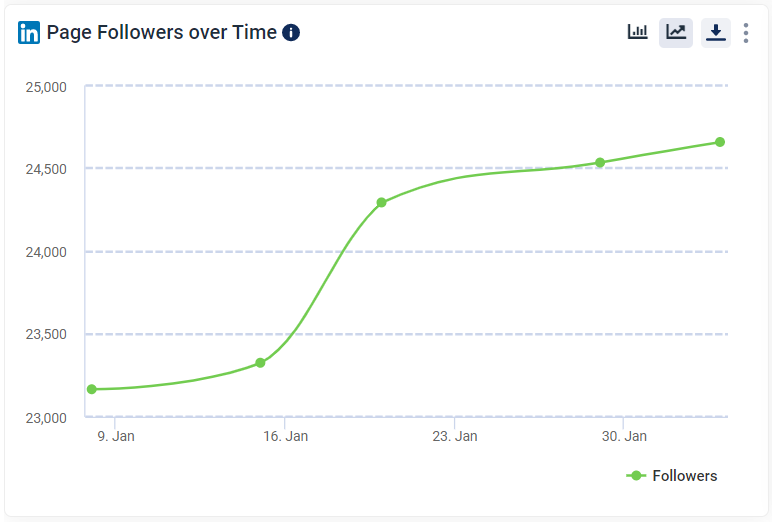
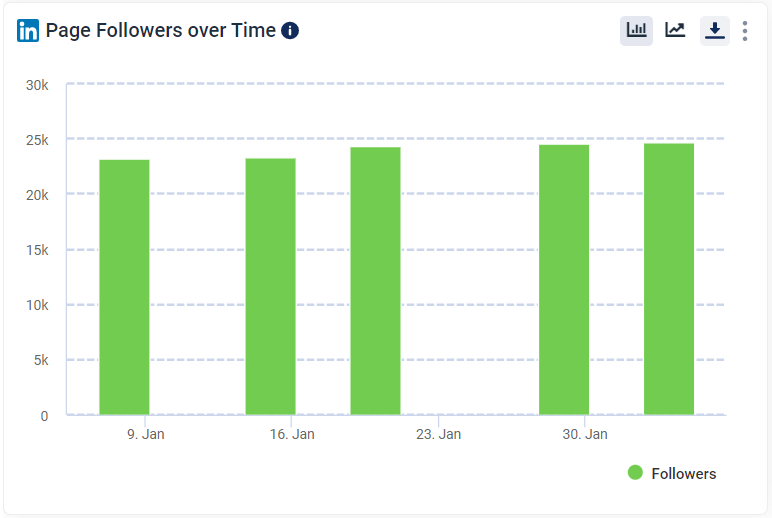
Page Followers over Time
This Chart will help you understand the total follower change with respect to time. Please note that 30 days previous duration data will be available for this chart from the day you authenticate your business page.
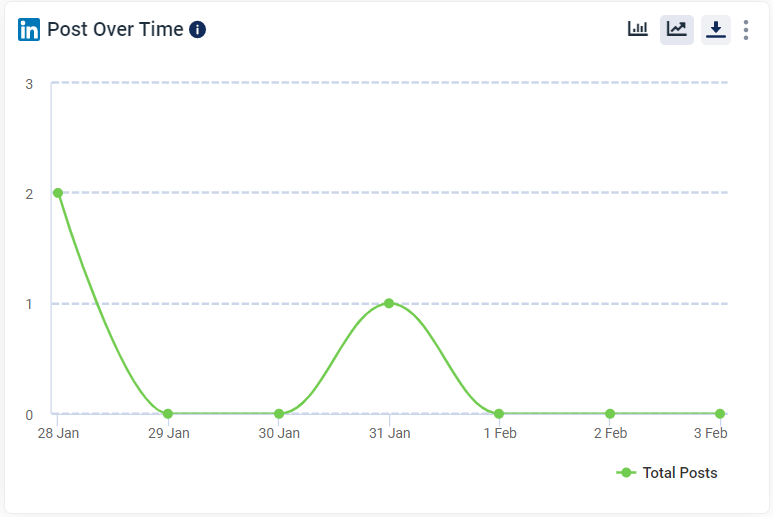
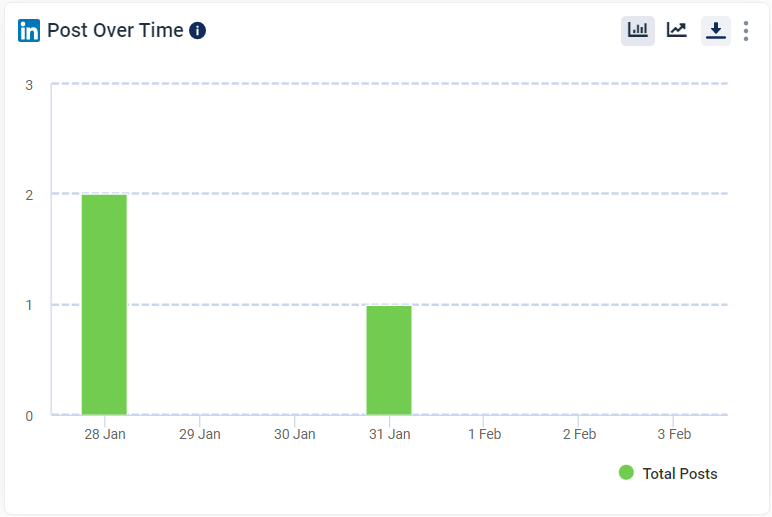
Post Over Time
This chart will allow you to see the total number of post published for the specific date range selected.
Total Post Clicks
This chart represent the total number of clicks on your content, company name or logo by a (signed in) member.
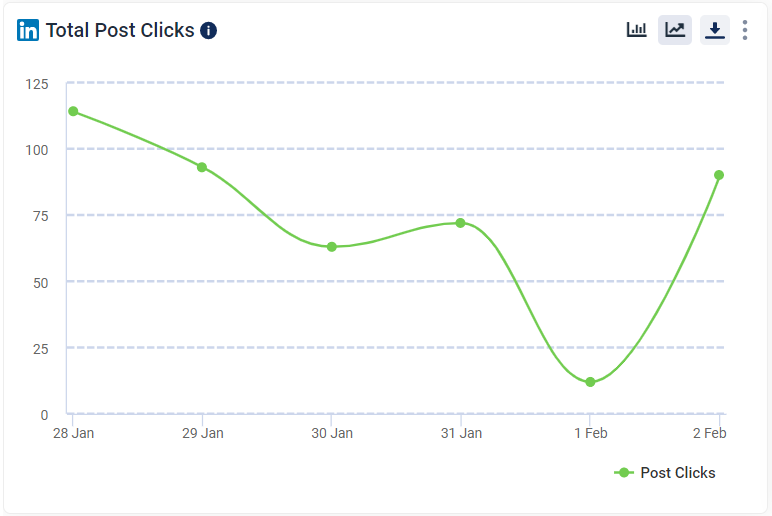
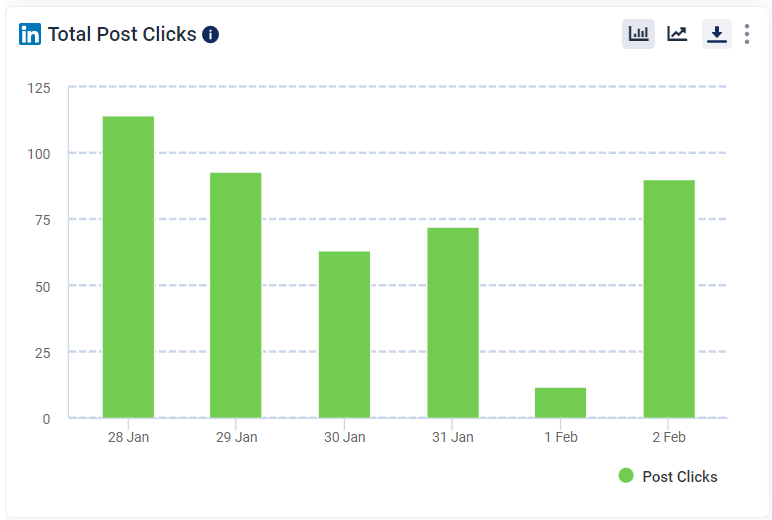
Please note that this chart does not include interactions.
Post Likes
This chart shows the number of times people have engaged with your post.
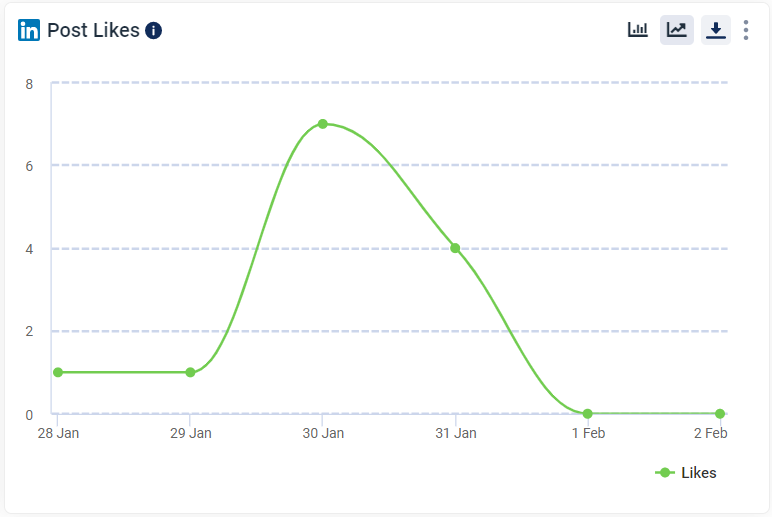
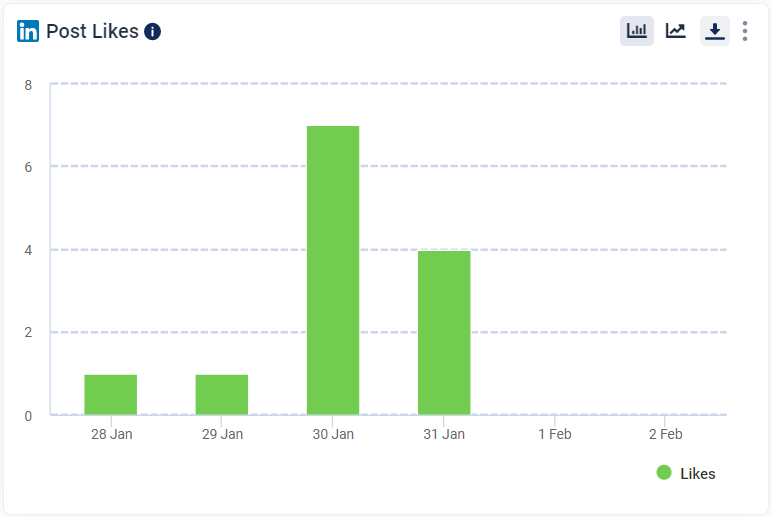
Chart 5: Post Comment
This Chart shows the number of times people have engaged with your post through comments.
Similarly we also have more charts like Total Post Comment Mentions, Total Reposts, Total Post Share Mentions, Post Impressions, Unique Post Impressions & Post Engagement Rate which are available inside LinkedIN page analytics.
SECTION B : The Best LinkedIn metrics to track
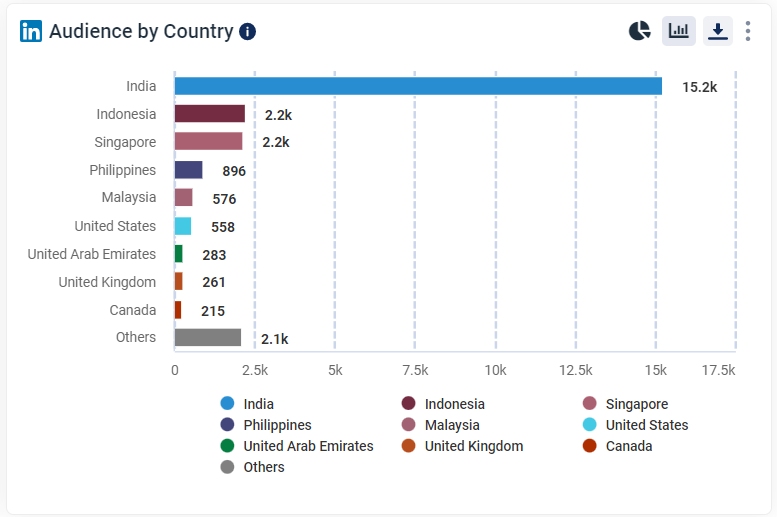
Radarr also allows you to gauge your audience by different metrics and segments such as country, job function, industry, region, seniority & company size. This charts are available in two view modes(pie & bar).
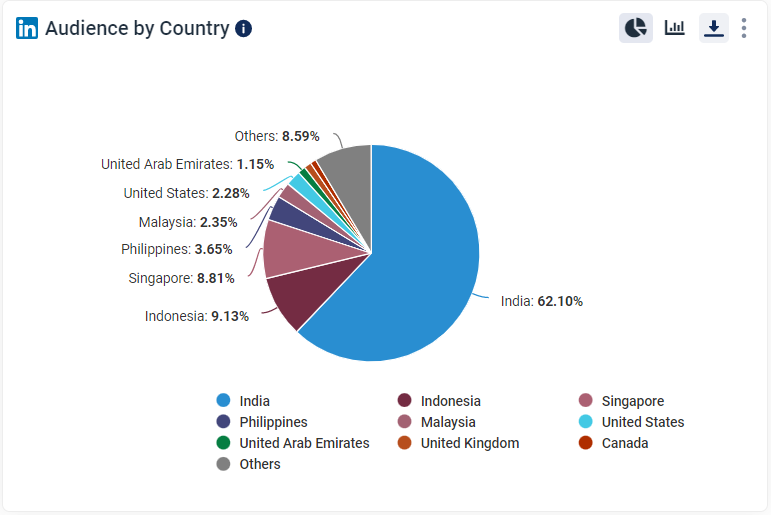
Audience by Country
This chart shows an aggregated demographic data based on country information that users provide in their LinkedIn profiles.
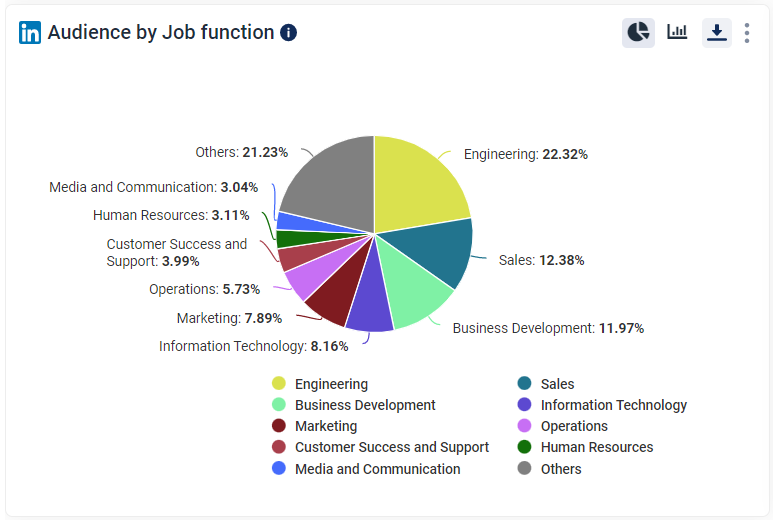
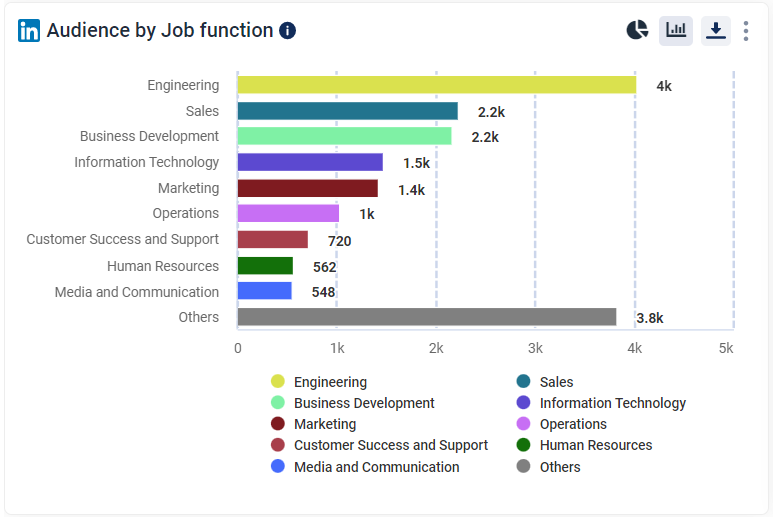
Audience by Job function
This chart is an aggregated demographic data based on function information that users provide in their LinkedIn profiles.
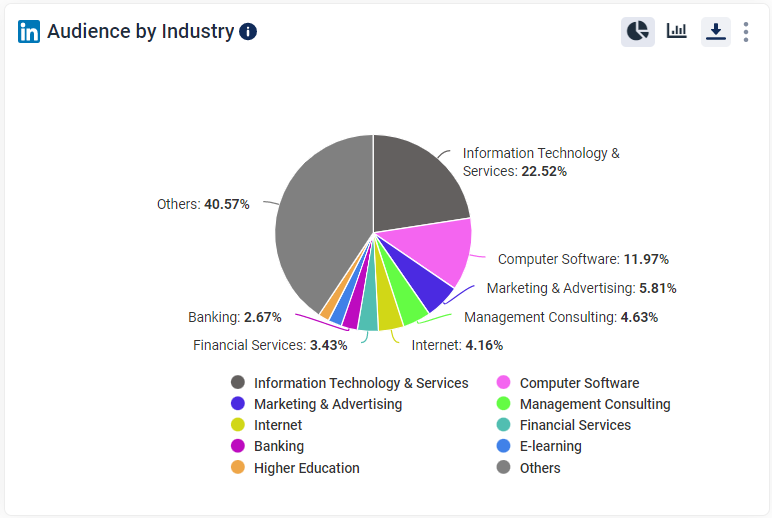
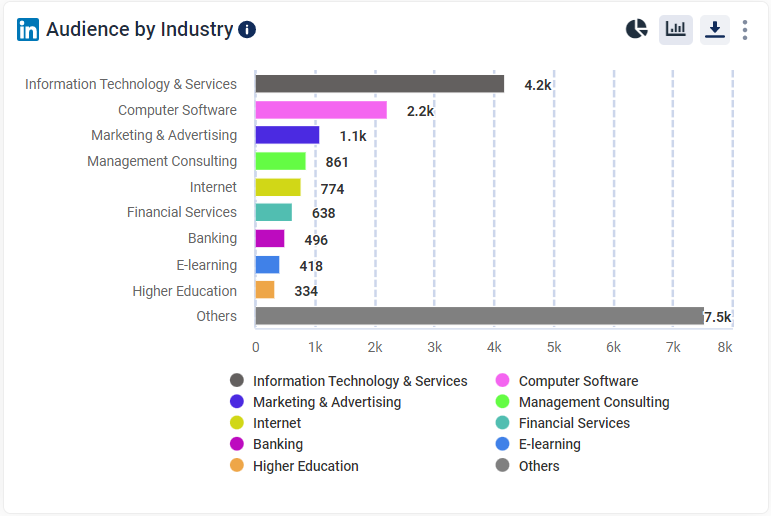
Audience by Industry
This chart shows an aggregated demographic data based on industry information that users provide in their LinkedIn profile.
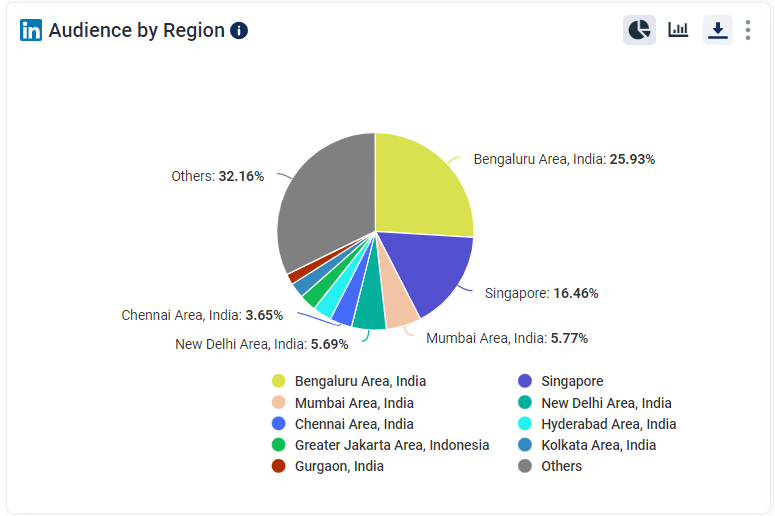
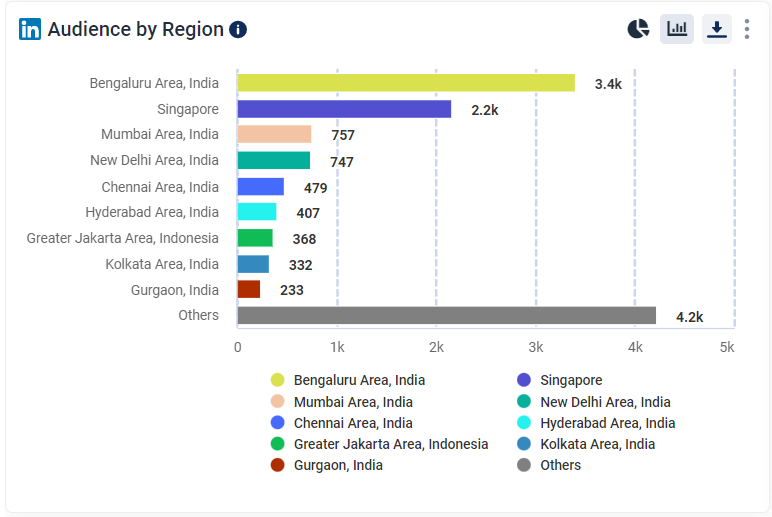
Audience by Region
This chart shows an aggregated demographic data based on region information that users provide in their LInkedIn profile.
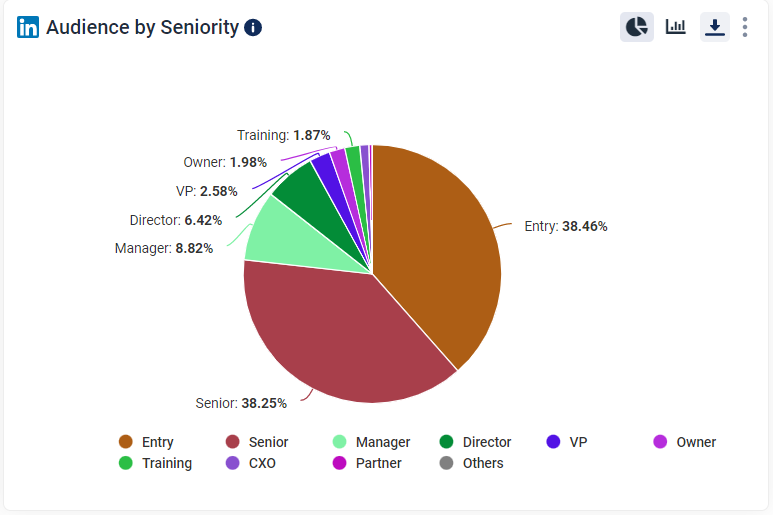
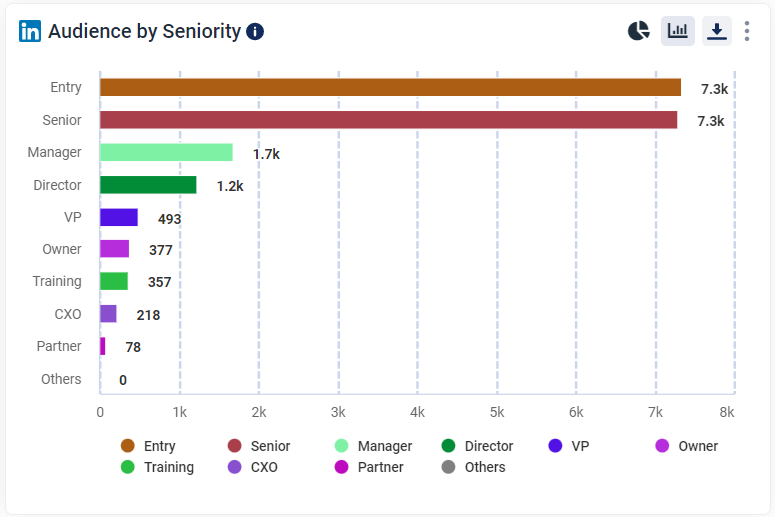
Audience by Seniority
This chart shows aggregated demographic data based on seniority information that users provide in their LinkedIn profiles.
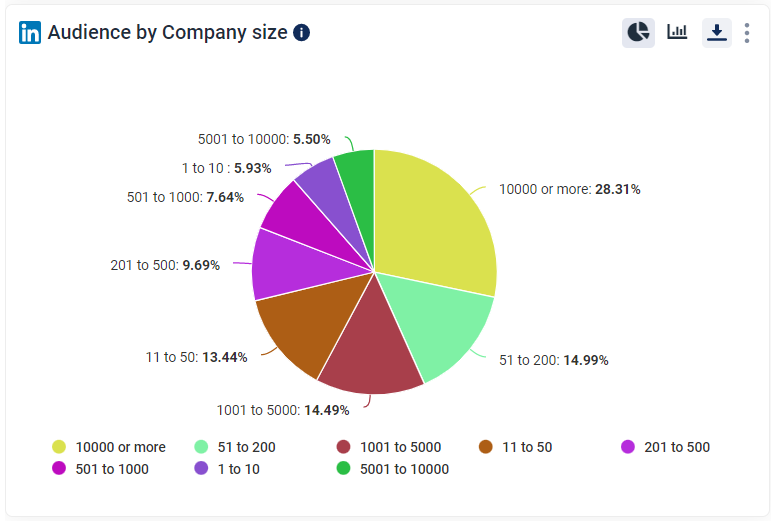
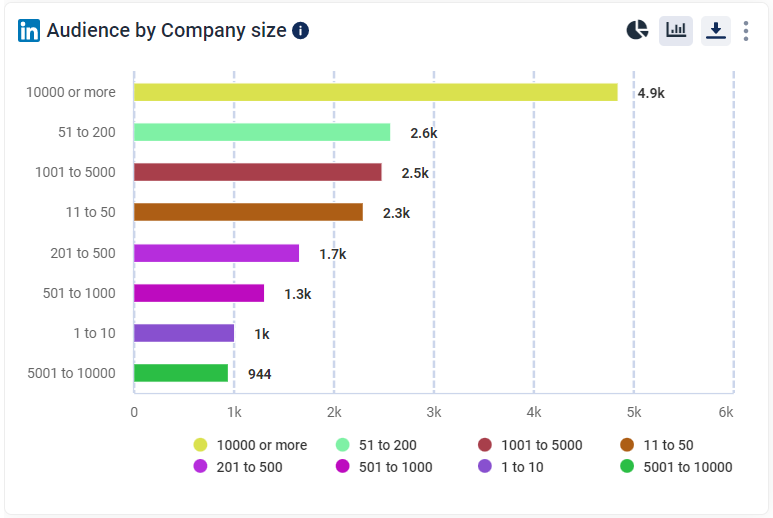
Audience by Company Size
This charts shows aggregated demographic data based on staff count range information that users provide in their LinkedIn profiles.
Please note that these estimates are provided by LinkedIn. The date filters will not be applied to this charts, we are showing you the aggregated data. Some labels might differ from LinkedIn insights.
Please reach out to support@radarr.com for any concern.