Data Usage for top booleans & queries
Radarr allows you to see the top data fetching topics or queries so that you can optimize based on your plan and requirements.
Data usage is now divided into 2 parts
(i) Overview – which is the overview of their current data usage
(ii)Analytics -A breakdown showing how much each query is fetching the data
To view the top data fetching queries, follow the below steps:
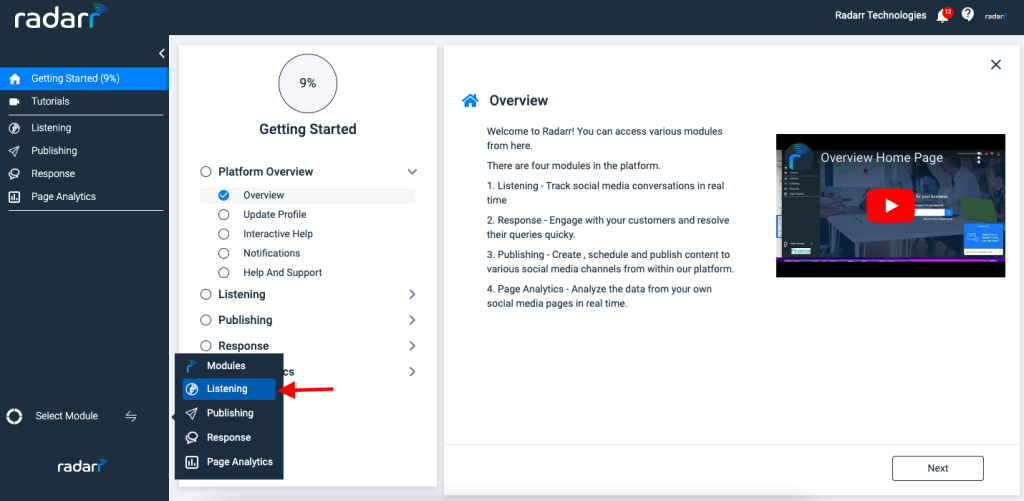
Once you log in to Radarr Platform, click on Listening Module
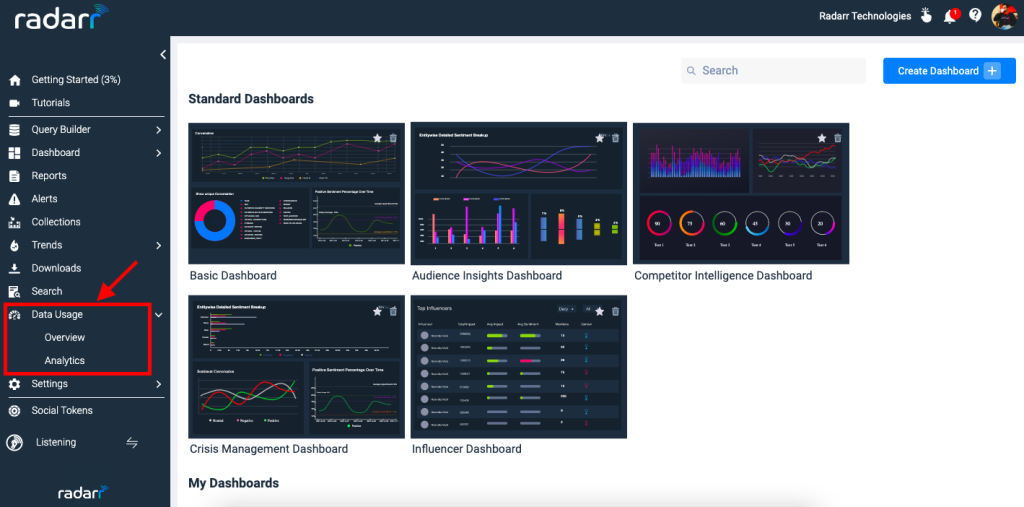
Under the Listening Module, select Data Usage and you will see the two sections – Overview & Analytics
(i) The Overview section will show you the current data usage, your current data plan, and the balance usage.
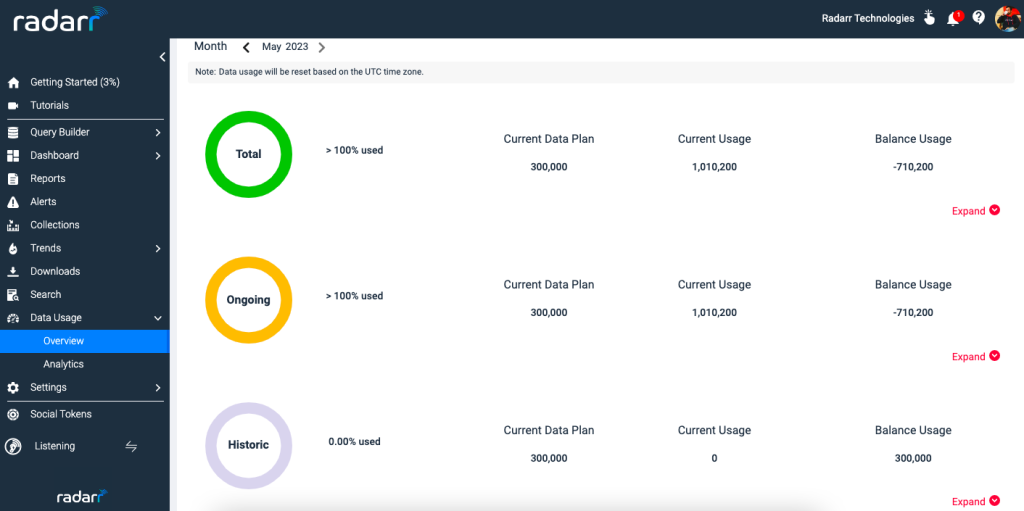
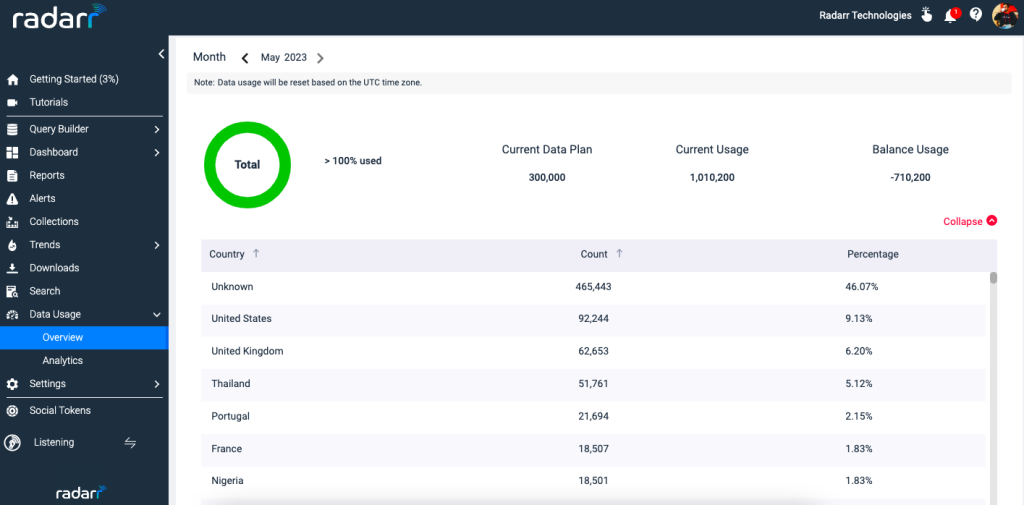
Also, it allows you to select duration and you can also expand to check from which country the data is fetching the most.
(ii) Analytics Section gives you a breakdown showing how much each query is fetching the data also it tells you about the topic status whether it’s a “Data Pull” topic or a “Display” topic. Here Pull refers to “Full Data” and Display refers to “Sample Data”
To understand the difference between Pull and Display please refer to the below article> https://support.radarr.com/radarr-knowledge-base/what-is-the-difference-between-data-pull-and-display
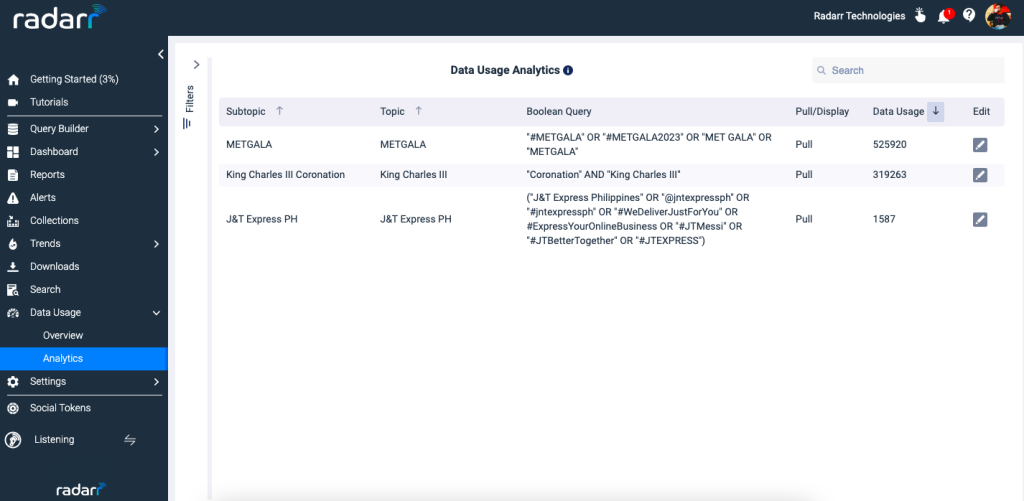
Based on the Analytics, you can click on the edit option and adjust your queries to optimize the data usage.
That’s it! You’re done. You have now got complete control over your data usage.
Note: By default, all the topics will be selected, filters are provided so that you can select the topics, exclusions, etc. Also, only current youtube data will be considered in the data usage analytics section.
Thank you for reading the article, do reach us at support@radarr.com for any assistance.