Radarr Help and Support
What is an SLA dashboard?
Table of Contents
An SLA dashboard present in the SMR dashboard section of Radarr BY GENESYS allows you to analyze your response agent’s performance against pre-set SLA (Service Level Agreement) timelines.
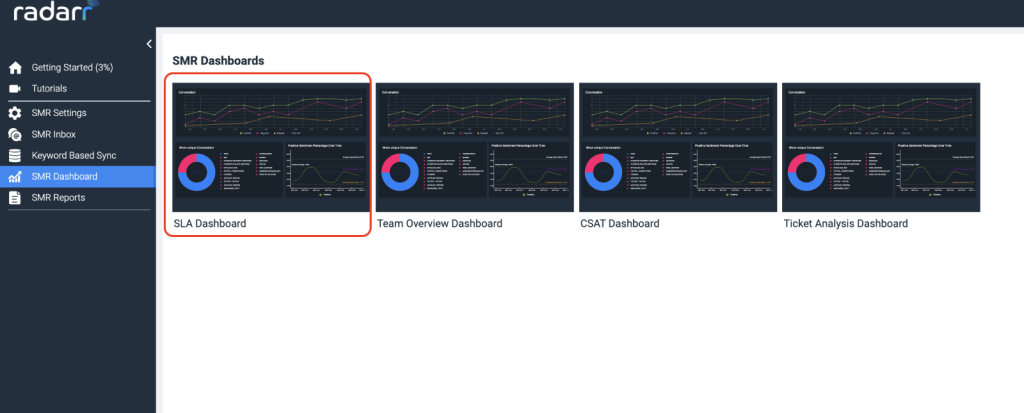
Fig: SLA Dashboard
On clicking the dashboard, users can view different metrics that provide an aggregated view of a team’s performance in responding to tickets on the SMR platform. Some of the metrics available are as follows. Please note that all these metrics are based on business hours.
- Average first response time – This metric shows the average time taken by all the agents for their first response to tickets assigned to them. If this number falls within the SLA set in the Business Hours section of SMR settings, the font color would be green, otherwise, it would be in red.
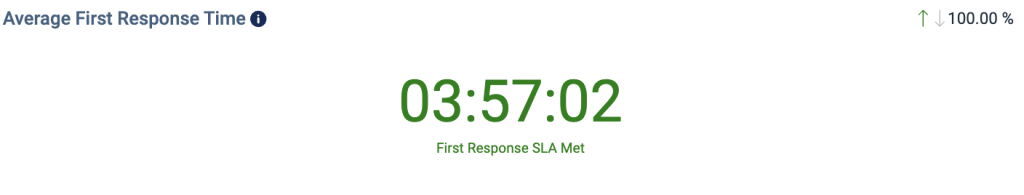
Fig: Average First Response Time
- Average resolution time – This metric shows the average time taken by all the agents to resolve tickets assigned to them. If this number falls within the resolution time SLA set in the Business Hours section of SMR settings, the font color would be green, otherwise, it would be in red.

Fig: Average Resolution Time
- First Response Time Distribution – This chart represents the distribution of the different first response times to total tickets created.
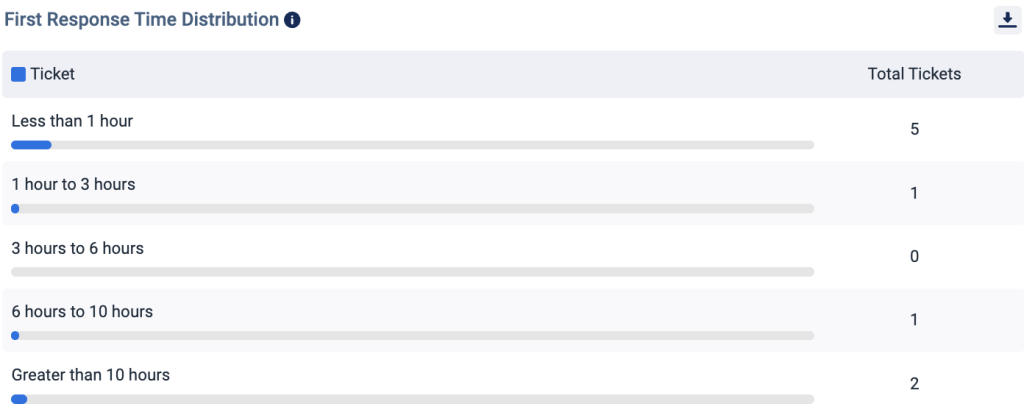
Fig: First Response Time Distribution
- Ticket Closure and SLA% by Platform– This chart represents that for each platform how many of the tickets were closed within the set SLA timelines. For this chart, only the closed and invalid status tickets are considered.
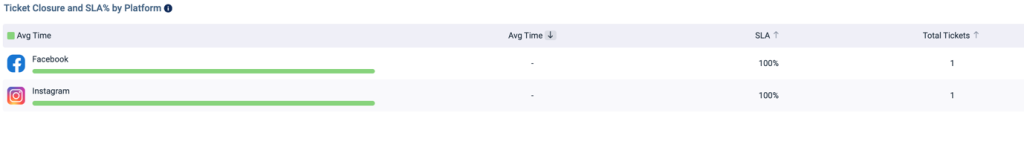
Fig: Ticket Closure and SLA% by Platform
- Average First Response Time and SLA % by Platform– This chart represents how for each platform how many of the tickets were provided a first response within the set SLA timelines.
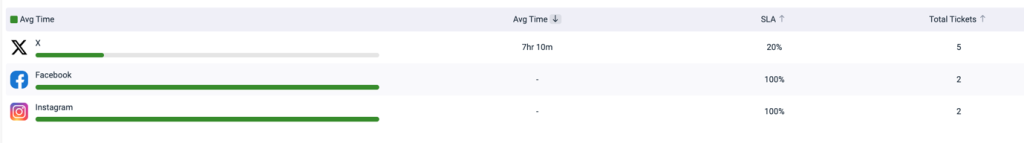
Fig: Avg Time