Radarr Help and Support
Team Overview Dashboard
Table of Contents
Track ticket progress and agent assignments in one place with the Team Overview Dashboard
Ticket Analytics categorizes tickets based on their current status
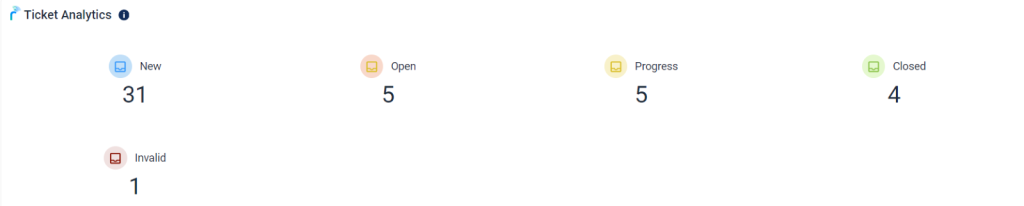
Fig: Ticket Analytics
The Team Overview widget provides a snapshot of active tickets, completed tickets, and average time agents take to resolve issues
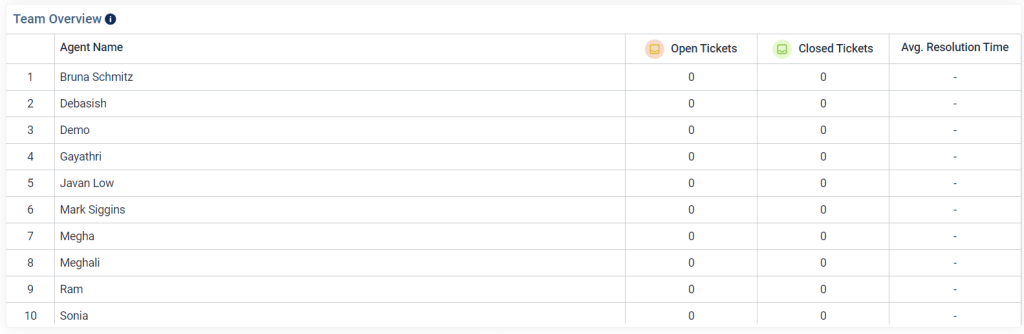
Fig: Team Overview
The Average First Response Time Userwise chart shows how quickly users are getting initial responses, along with total tickets and SLA adherence (calculated during business hours).
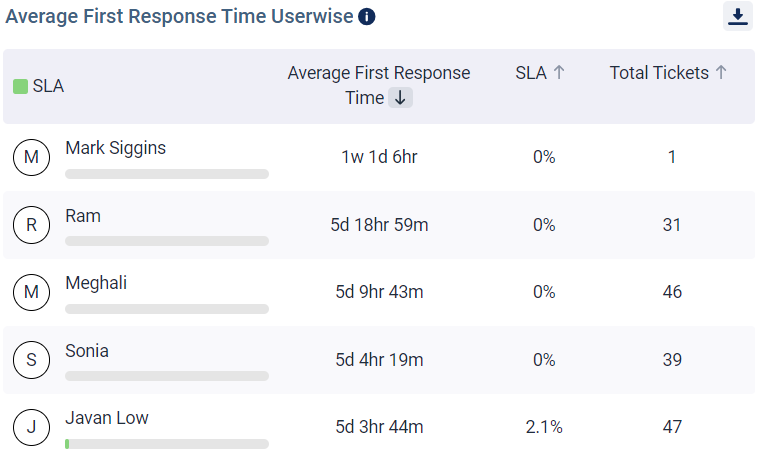
Fig: Average First Response Time Userwise