CSAT Dashboard
The CSAT Dashboard displays data based on the surveys filled by the customers.
The following charts are available under the CSAT Dashboard.
- CSAT Score
- NPS Score
- CSAT over Time
- CSAT by Agent
- Platform wise Sentiment
- CSAT by Platform
- CSAT Score:
Customer Satisfaction Score, or CSAT score, is a customer experience metric that measures happiness with a product, service, or customer support interaction through a customer satisfaction survey. We are calculating this by using the formula CSAT score= no of surveys which got 4 or 5 stars/total surveys received *100.
Select the profile and apply the filters required to display the CSAT Score
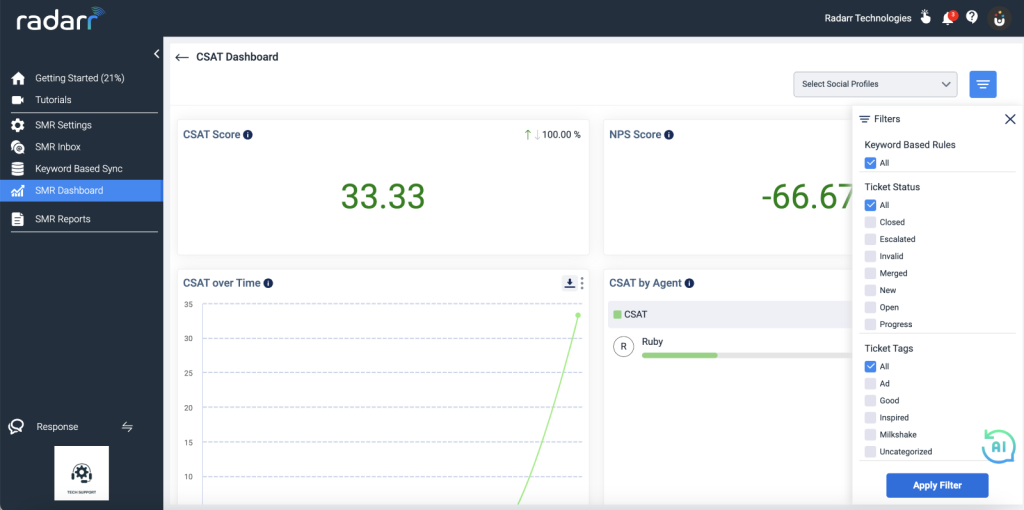
Fig: CSAT Score
- NPS Score:
Net Promoter Score (NPS) is a customer loyalty and satisfaction measurement taken from asking customers how likely they are to recommend your product or service to others on a scale of 0-10. We are calculating this by using the formula (promoters (9-10)- detractors (0- 6))/total_hits *100.

Fig: Example of NPS Score for selected profiles and filters
- CSAT over Time
This chart represents your customer satisfaction score over a period.
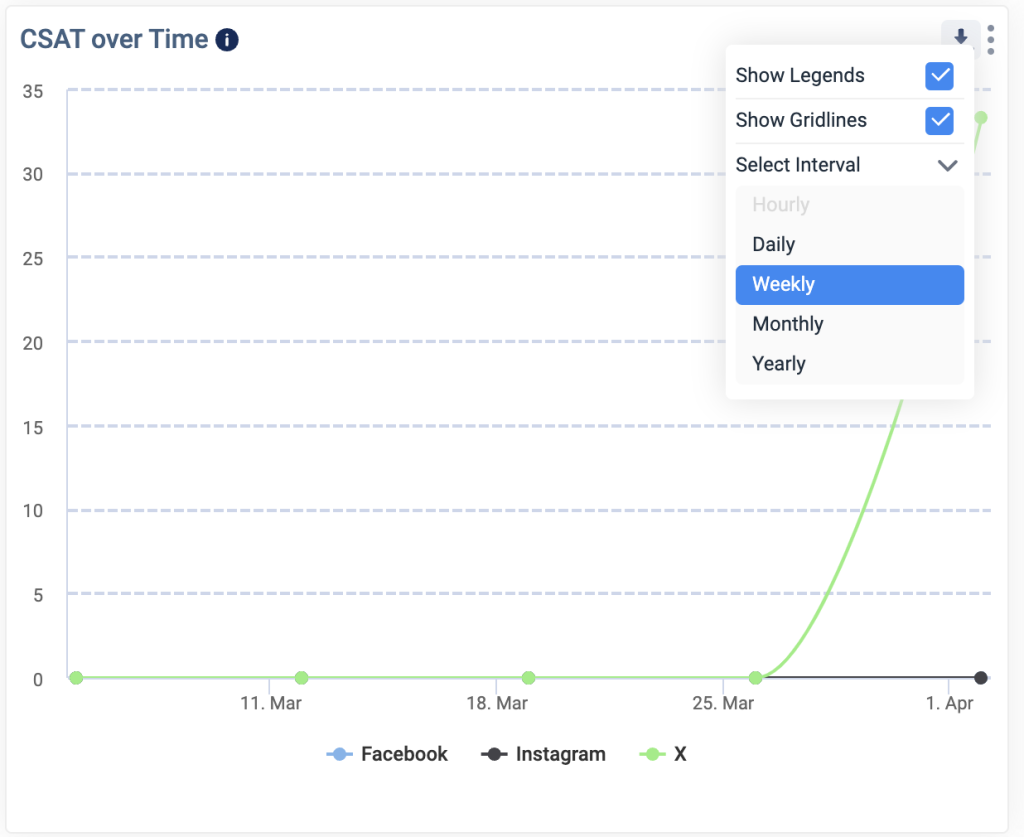
Fig: CSAT over time
- We can choose the Interval as Daily, Weekly, Monthly or Yearly
- We can Download the chart in CSV or PNG Format
- CSAT by Agent
This chart represents the agent-wise total number of tickets that received responses to the survey and CSAT shows out of those tickets how many received 4 or 5 stars
Fig: CSAT by Agent
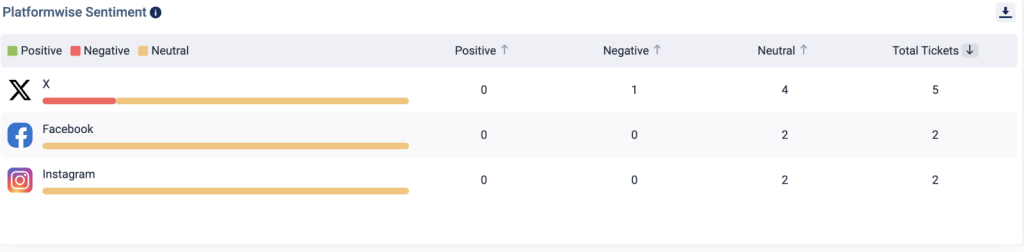
- Platform wise Sentiment
This chart tracks platform-wise split of sentiments as positive, negative, and neutral along with the total number of tickets.
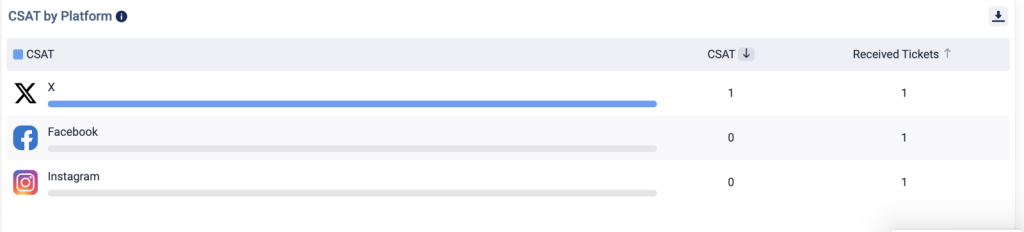
- CSAT by Platform
This chart represents platform-wise total number of tickets that received response to the survey and CSAT shows out of those
tickets how many received 4 or 5 stars.