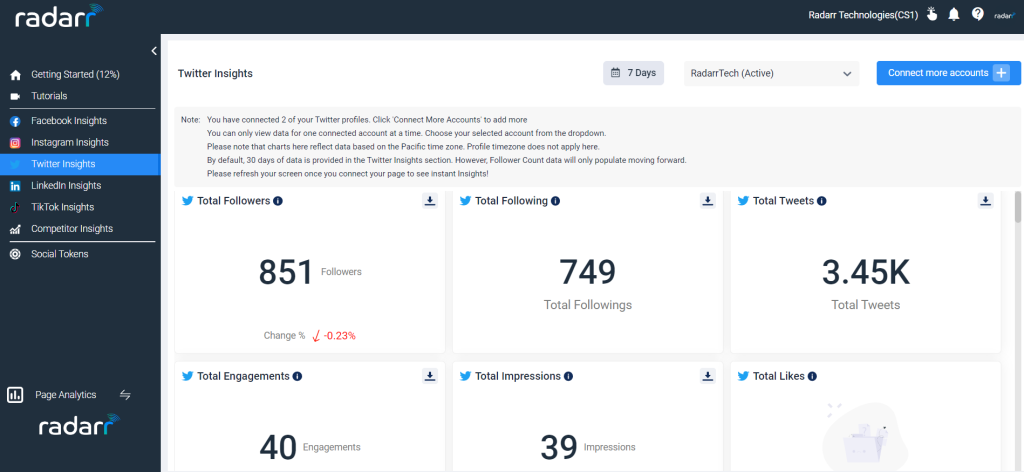
Twitter Insights
Twitter Analytics in Radarr allows you to track and view key metrics, like follower gain/loss, impressions, engagement rate, retweets and more.
Using Twitter Insights for business helps you make data-driven decisions about your social media strategy. Armed with data, Radarr provides the best Twitter metric to track for optimizing your Twitter campaigns to get better results and more followers without guessing whether your plan will work or not.
Twitter metrics to track for the best results
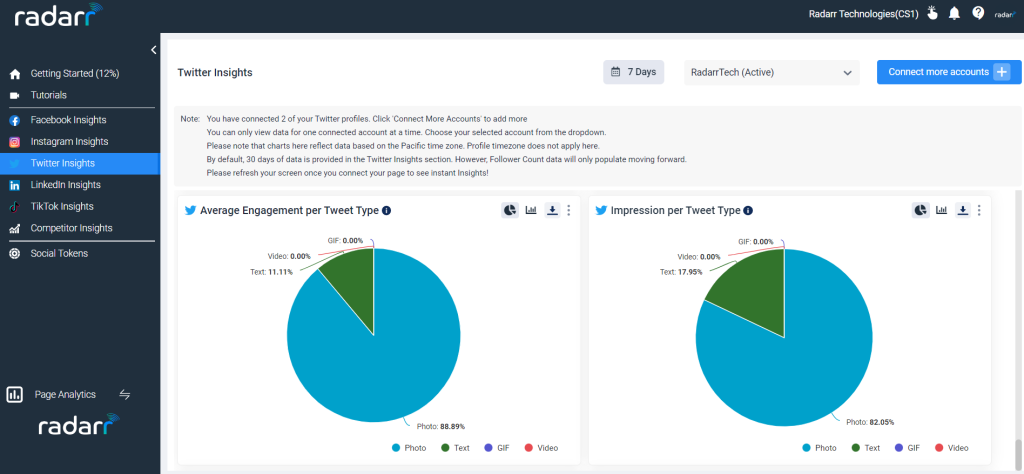
Total Impressions
It is the number of views your Tweet received. It tells you how many eyeballs are on your content. This, combined with your engagements, is what gives you an engagement rate for each Tweet and your overall account. Impressions tell you if people find your content compelling.
Sometimes, getting high impressions can simply be due to the hashtag(s) you use, so play around with different ones to find what works best.
Total Engagement
Twitter will show your most popular Tweet for each month (or other date range selected). You can also find your Tweets listed with their engagement rate on the Tweets page. This is what your audience is responding to the most. Give them more of that.
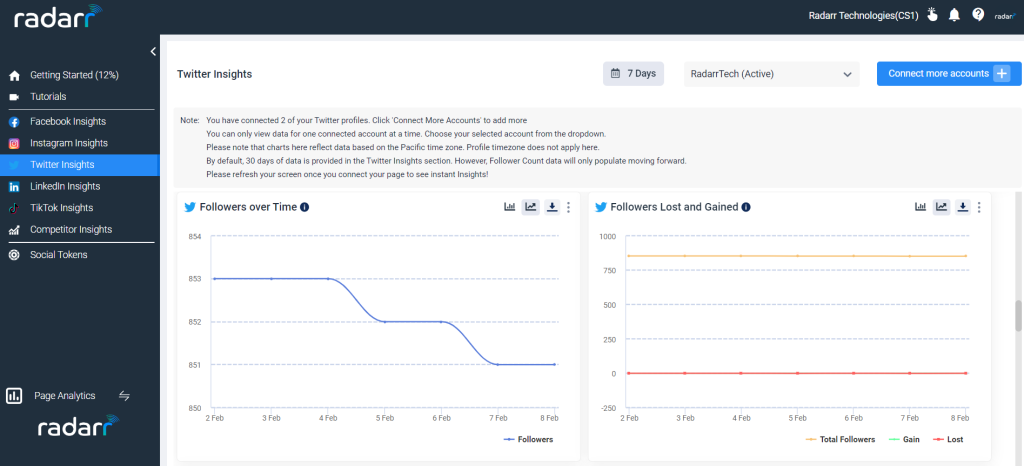
Twitter followers analytics
Follower gain/loss
What it is: The number of followers you gained or lost over a specific time period. This is available in both the Dashboard and Tweets pages.
Why it matters: This is often the top Twitter metric to track, or near the top, for most businesses. It’s one of your main signals of growth alongside your engagement metrics.
Top followers
What it is: The person with the most followers who recently followed you. You can find this on your Dashboard page.
Why it matters: What if The Biebs follows you and you didn’t know? But seriously, this is a quick and easy way to keep track of the movers and shakers you’re connected to.
Twitter engagement analytics
Engagements
What it is: The big juice! Engagements are all the interactions people have had with your Tweet. That includes:
- Link clicks
- Hashtag clicks
- Expanding to view the full Tweet
- Clicking your Twitter profile photo or username
- Retweets
- Replies
- Follows
- Likes
So, just about everything then.
Why it matters: The reason all of these are part of engagements is to determine the overall engagement rate of your Tweets. You can view detailed statistics for each of the above-mentioned Twitter analytics, too.
Having a high-level overview of your engagements lets you quickly determine which tweets are working for you and which aren’t.
Engagement rate
What it is: Here’s some math for ya: (Engagements ÷ Impressions) = Engagement rate. On the Tweets page, you can see the engagement rate of each Tweet as well as your average rate.
Why it matters: Your engagement rate is a good indicator of overall performance. After all, if a Tweet lands in the forest, but there’s no one around to retweet it, did you ever really tweet at all?
Not really. Because if no one is interacting with your Tweets, you’re wasting your time. Setting a benchmark for your engagement rate and tracking it over time will help guide your social media strategy.
We can reach the conclusion that Radarr is a must-have Twitter Analytics tool. Seeing your Twitter analytics alongside your other platforms lets you consider the bigger picture as you evaluate your social media strategy.
Reach us at support@radarr.com for any concern